


Understanding Gold to Platinum Price Ratios: A Comprehensive Guide
Disclaimer: Global Coin is a dealer of precious metal coins and does not provide investment, financial, or legal advice. Any information provided in this content, including market commentary and insights, is for informational purposes only and should not be construed...

Disclaimer:
Global Coin is a dealer of precious metal coins and does not provide investment, financial, or legal advice. Any information provided in this content, including market commentary and insights, is for informational purposes only and should not be construed as investment advice. Investors should conduct their own due diligence and consult with a qualified financial professional before making any investment decisions. Gold and rare coin investments involve risks, and past performance is not indicative of future results.
The gold-to-platinum price ratio underscores the shifting dynamics of precious metals investments, presenting unique opportunities for discerning collectors. At Global Coin, we leverage our exclusive access to rare and graded platinum coins to provide investors with assets that are virtually impossible to price shop. While gold's safe-haven appeal continues to drive its premium, platinum's relative affordability—highlighted by the current ratio—signals an opportunity for collectors seeking undervalued rarities. We guide clients toward investment-grade platinum coins with exceptional historical significance, pristine grading, and limited mintage. These high-value pieces not only diversify portfolios but also offer long-term appreciation potential, making them a strategic addition for those looking beyond traditional gold holdings.

The gold to platinum price ratios show how many ounces of platinum you need to buy an ounce of gold bullion, highlighting the market dynamics and pricing of these precious metals. It’s crucial for investors to spot trends and make smart decisions. In this article, we break down what this ratio means, its historical trends, key price drivers, and its impact on investments.
Key Takeaways
-
The gold-to-platinum price ratio indicates the relative pricing strength of gold compared to platinum, informing investment strategies and market sentiments.
-
Historical fluctuations in the ratio highlight the impact of economic downturns and industrial demand, particularly the roles of gold as a safe haven and platinum’s industrial applications.
-
Investors should consider the unique characteristics and market behaviors of gold and platinum for effective portfolio allocation and risk management.
-
Research suggests it helps investors spot trends and make decisions, reflecting economic conditions and market sentiments.
-
It seems likely that the ratio has fluctuated historically, with recent data showing a ratio of about 3 troy ounces of platinum for one troy ounce of gold as of March 2025, indicating gold is more valuable than platinum.
-
The evidence leans toward gold being more expensive than platinum in recent years, contrary to the general belief that platinum is usually pricier due to scarcity.
What is the Gold to Platinum Price Ratio?

The gold to platinum price ratio is a metric that tells us how many ounces of platinum are required to purchase one ounce of gold, calculated as the price of gold per ounce divided by the price of platinum per ounce. For example, as of March 2025, with gold at approximately $2,906.40 per ounce and platinum at $970.78 per ounce, the ratio is about 2.99, meaning you need nearly 3 ounces of platinum to buy one ounce of gold. This ratio is crucial for investors to understand relative value and market dynamics, helping them decide when to buy or sell these metals based on economic trends.
Having access to live gold data and charts is essential for investors to stay informed about real-time market conditions. This allows them to make well-informed trading decisions by keeping up-to-date with price alerts and tools.
The gold-to-platinum price ratio is a fascinating metric that tells us how many ounces of platinum are required to buy one ounce of gold. It reflects the relative price strengths of these two valuable metals. When the ratio is high, gold is more expensive compared to platinum, and when it is low, platinum is pricier.
Investors and analysts closely track this ratio as it provides critical insights into the broader economic trends. This ratio acts as a barometer of market sentiment, showing whether investors are flocking to gold as a safe haven or betting on platinum’s industrial might. A low gold-to-platinum ratio might suggest that platinum is overpriced relative to gold, serving as a useful timing tool for strategic investments.
The gold-to-platinum ratio serves multiple purposes. It helps investors decide when to buy gold or platinum and illustrates the dynamic interplay between these two metals within the global economy. Understanding this ratio helps investors navigate the complexities of the precious metals market and make more informed decisions.
Calculating the Gold Platinum Ratio
Calculating the gold platinum ratio is a straightforward process that involves dividing the price of gold by the price of platinum. This ratio indicates the relative strength of gold prices compared to platinum prices, offering valuable insights for investors. To calculate the ratio, you can use the following formula:
Gold Platinum Ratio = Gold Price ÷ Platinum Price
For instance, if the current gold price is $1,500 per ounce and the current platinum price is $1,000 per ounce, the gold platinum ratio would be:
Gold Platinum Ratio = $1,500 ÷ $1,000 = 1.5
This means that one ounce of gold is currently worth 1.5 times the value of one ounce of platinum. Understanding this ratio helps investors gauge the relative value of these metals, aiding in strategic decision-making. Whether you’re looking to buy gold or invest in platinum, knowing the gold platinum ratio can provide a clearer picture of market dynamics and potential investment opportunities.
Historical Trends in Gold to Platinum Ratios
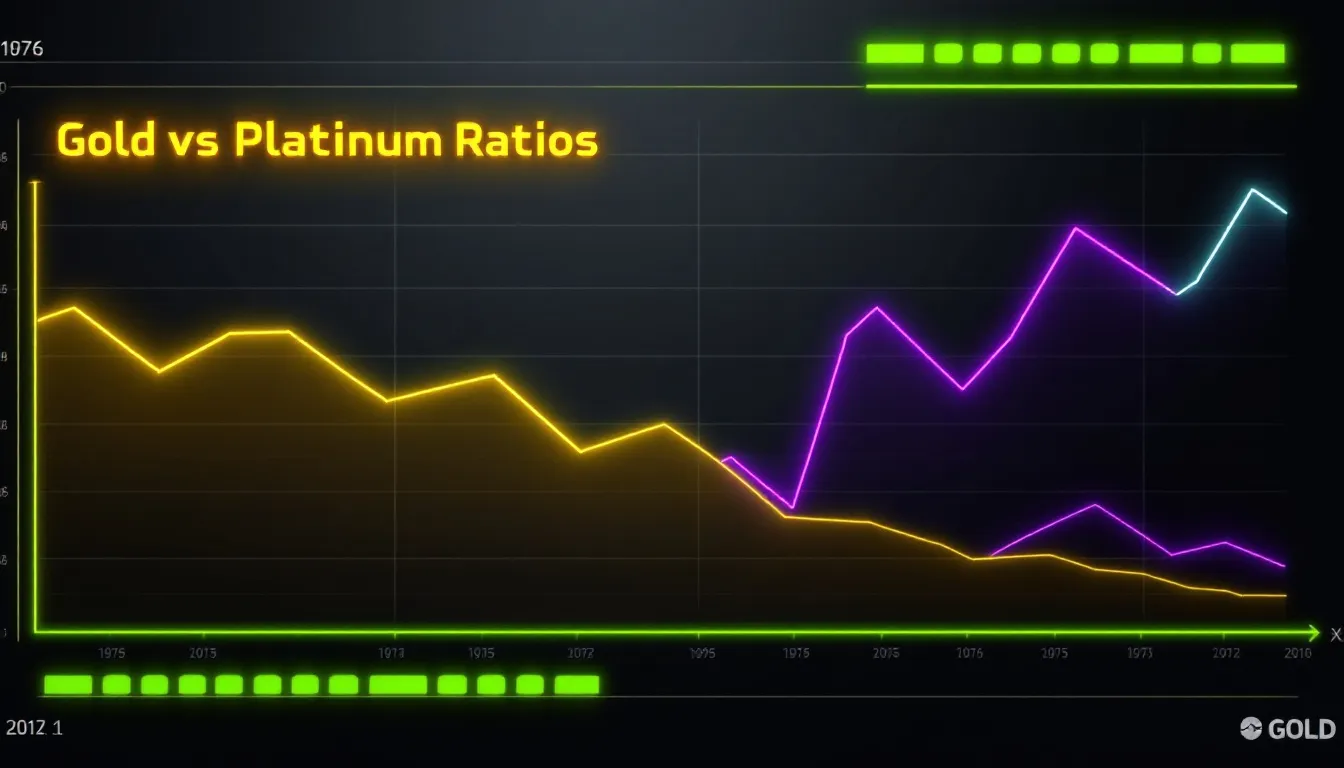
The historical journey of the gold-to-platinum ratio is marked by significant fluctuations, mirroring the ebb and flow of global economic conditions. For example, this ratio reached a notable peak in 2015 when it hit approximately 1.75, signaling that gold was significantly more valuable than platinum at that time. Another remarkable spike occurred in 2020, driven by the economic turmoil of the COVID-19 pandemic, pushing the gold platinum ratio to around 2.5.
Over the last two decades, the gold-to-platinum ratio has typically ranged between 1.0 and 2.0, reflecting the relative volatility in the pricing of both metals. However, this range is not set in stone. Historical records indicate extreme values, with the ratio being as low as 0.05 in 1885 and as high as 6.63 in 1968. These dramatic fluctuations underscore how crucial it is to understand the factors driving these changes.
Periods of economic downturns and high uncertainty have consistently influenced the gold-to-platinum ratio. For instance, the analysis of spikes and troughs in years like 2015 and 2020 provides crucial insights to verify how market dynamics respond to global events. These historical trends are not just numbers; they are narratives of economic resilience and connection to industrial shifts.
Factors Influencing Gold and Platinum Prices
Several factors play pivotal roles in determining the prices of gold and platinum. For platinum, supply constraints are a significant influencer, with over 75% of its production concentrated in South Africa. Geopolitical instability in this region can lead to substantial supply disruptions, driving platinum prices higher. Conversely, gold’s value tends to rise during times of economic uncertainty, serving as a safe-haven asset.
The 2008 financial crisis is a prime example where gold outperformed platinum due to a stark drop in industrial demand for platinum. Inflation rates and the strength of currencies also directly impact the prices of these metals. Typically, a stronger U.S. dollar leads to lower platinum prices.
Central bank policies and interest rates further influence precious metal prices. Actions taken by central banks can stabilize gold prices while affecting the demand for platinum. The industrial applications of platinum, such as in automotive catalytic converters, closely tie its demand to the health of the automotive industry. Grasping these factors is crucial for predicting future trends in gold and platinum prices.
Breakdown of Demand / Supply Factors:
Gold and platinum prices are influenced by a variety of factors, some unique to each metal and others affecting both similarly. Understanding these is crucial for grasping how their price ratio changes.
For platinum:
-
Supply Constraints: Over 75% of platinum is produced in South Africa, making its supply vulnerable to regional disruptions like labor strikes or power outages, which can lead to price increases.
-
Industrial Demand: Platinum is extensively used in catalytic converters for automobiles, its largest application. The health of the automotive industry, therefore, directly impacts platinum demand and prices, with demand rising with stricter emission standards.
-
Investment Demand: While less than gold, platinum also has some investment demand, particularly in coins and bars. Economic conditions favoring precious metals can affect its price.
For gold:
-
Safe-Haven Status: Gold is often seen as a hedge against inflation and economic uncertainty. During crises, investors flock to gold, driving up its price, as seen in 2008 and 2020.
-
Central Bank Policies: Decisions on interest rates and monetary policies can influence gold prices. Lower rates typically make gold more attractive, reducing the opportunity cost of holding it.
-
Jewelry Demand: A significant portion of gold demand comes from jewelry, influenced by economic growth, particularly in emerging markets like China and India, affecting its price dynamics.
Both metals are also affected by:
-
Currency Strength: Priced in U.S. dollars, a weaker dollar makes these metals more affordable to foreign buyers, potentially increasing demand and prices.
-
Global Economic Growth: Strong growth can increase demand for both, while recessions can reduce it, impacting the ratio.
-
Geopolitical Tensions: Unstable situations can drive investors towards gold, affecting its price relative to platinum.
Economic and Industrial Impacts on Price Ratios

Economic uncertainty and industrial demand create a complex interplay between gold and platinum, influencing their price ratios. Historically, gold tends to surpass platinum during periods of economic turmoil, reflecting a shift in investor confidence towards safer assets. During the Great Depression of the 1930s, both industrial and jewelry demand for platinum declined, bringing the gold-to-platinum ratio closer to parity.
Understanding live gold data is crucial for investors to gauge market sentiment and economic impacts. Real-time market data and charts for gold prices provide up-to-date price alerts and tools, enabling well-informed trading decisions in the precious metals market.
Platinum’s role in the automotive industry is another critical factor. The introduction of catalytic converters in the late 1940s significantly boosted platinum demand, maintaining a higher platinum-to-gold ratio until the economic downturn of the 1970s. As new environmental regulations continue to emerge, the demand for platinum in automotive applications is expected to rise.
Technological advancements and the shift towards green technologies could also impact platinum prices significantly. For instance, the rise of electric vehicles has created new avenues for platinum demand, potentially influencing its price ratio relative to gold. These industrial dynamics highlight the multifaceted nature of the gold-to-platinum price ratio and its susceptibility to broader economic and technological trends.
The Gold to Platinum Ratio in the 21st Century

Since the turn of the millennium, the gold-to-platinum ratio has experienced significant changes, particularly during economic downturns. The ratio surged during the COVID-19 pandemic, reflecting gold’s strong performance as a safe-haven asset compared to platinum. Interestingly, by 2008, the ratio fell below 1.0 for the first time in decades, indicating a shift in demand dynamics that temporarily favored platinum.
The trends observed in the 21st century often mirror the broader economic landscape. The mid-2000s commodity boom saw a surge in platinum prices. Conversely, the 2008 financial crisis led to a substantial rise in the gold-to-platinum ratio. These shifts underscore the importance of understanding the underlying factors that drive these ratios.
Comparing recent trends with historical averages reveals that the gold-to-platinum ratio has consistently reflected the changing tides of the global economy. Whether during the financial crisis or the pandemic, the ratio serves as a valuable indicator of market sentiment and economic health.
Comparing Gold and Platinum as Investment Assets

Gold and platinum, while both precious, serve different roles in an investment portfolio. Historically, gold is regarded as a safer investment due to its stability and lower price volatility compared to platinum. This makes gold bullion a preferred choice during periods of global uncertainty.
However, holding both metals can enhance diversification and potentially improve returns while managing risk. A balanced investment portfolio that includes both gold bullion and platinum provides protection against market volatility and inflation. Monitoring fluctuations in the gold-to-platinum ratio can indicate potential investment opportunities and inform asset allocation strategies.
Long-term performance analysis shows that both gold and platinum serve as effective hedges against inflation and economic uncertainty. While gold’s liquidity and accessibility make it more appealing to investors, platinum’s industrial applications offer unique value propositions. Strategic investment decisions should consider the unique characteristics of each metal for portfolio resilience. The Gold to Platinum Ratio in the 21st Century
In the 21st century, the gold to platinum price ratio has continued to reflect the dynamic interplay between economic conditions and industrial demand.
At the millennium’s start, platinum traded higher than gold, with the ratio less than 1, due to strong industrial demand and stable economic conditions not driving significant gold demand. This persisted until around 2008, when the financial crisis marked a turning point. As economies faltered, gold’s safe-haven status propelled its price higher, while platinum prices were affected by reduced industrial demand, increasing the ratio above 1.
In 2015, the ratio was approximately 1.75, with gold around $1,150 per ounce and platinum around $657 per ounce, indicating gold’s value. This trend intensified in 2020 during the COVID-19 pandemic, with the ratio reaching 2.5, gold at $1,775 per ounce, and platinum at $710 per ounce, reflecting economic uncertainty.
As of March 2025, with gold at $2,906.40 per ounce and platinum at $970.78 per ounce, the ratio is about 2.99, suggesting gold remains more valuable, possibly due to ongoing uncertainties. Future movements will likely be influenced by recovery, inflation, and green technology transitions.
Comparing Gold and Platinum as Investment Assets
When considering precious metals for investment, gold and platinum offer different characteristics.
Gold is traditionally a safe-haven asset, performing well during instability, inflation, or currency devaluation, with lower volatility, making it a reliable store of value. Its demand is driven by jewelry and monetary use, ensuring enduring appeal.
Platinum, with higher industrial demand (especially automotive catalytic converters), is more sensitive to economic cycles and regulatory changes, offering diversification but with greater risk due to volatility.
From an investment perspective:
-
Stability vs. Volatility: Gold is more stable, while platinum swings more.
-
Safe-Haven vs. Industrial Metal: Gold is a crisis refuge, while platinum’s value ties to industrial growth.
-
Liquidity: Gold is highly liquid, with established markets; platinum, while liquid, has a smaller market, affecting transactions.
-
Correlation: Both have low correlations with stocks and bonds, useful for diversification, though their correlation can be higher due to shared factors.
Holding both can balance risk and returns, with gold providing a stable base and platinum exposure to industrial growth. Investors should assess risk tolerance.
Key Events Shaping Gold to Platinum Ratios

Several key historical events have significantly shaped the gold-to-platinum ratio. The ratio peaked at 6.63 in 1968, driven by central banks’ actions to stabilize gold prices while platinum prices surged. In the 1970s, the gold market experienced a bull run, while declining demand for platinum led to a decrease in the platinum-to-gold ratio.
Understanding these historical events is crucial, and utilizing live gold data provides real-time insights into how such events impact the ratio. Staying informed with up-to-date price alerts and tools helps investors make well-informed trading decisions in the precious metals market.
The rise of electric vehicles has recently increased the demand for platinum, impacting its price relative to gold. Key historical periods, such as the 1970s gold bull market and platinum’s industrial rise, played significant roles in shifting the gold-to-platinum price ratio. Grasping these events is crucial for understanding the dynamics that influence these precious metals.
Several historical events have significantly influenced the ratio:
-
1968: End of Gold Standard: Increased gold volatility, with the ratio peaking at 6.63, reflecting uncertainty.
-
1970s Oil Crises: High inflation drove gold prices up, while platinum rose with automotive demand, complex ratio dynamics.
-
Catalytic Converters: Late 1940s adoption boosted platinum demand, affecting the ratio until the 1970s.
-
2008 Financial Crisis: Gold surged as a safe haven, increasing the ratio above 1.
-
COVID-19 Pandemic (2020): Economic disruption raised gold prices, spiking the ratio to 2.5.
Using the Gold Platinum Ratio in Investment Decisions
The gold platinum ratio can be a powerful tool for investors aiming to diversify their portfolios with precious metals. By analyzing this ratio, investors can gain insights into the relative value of gold and platinum, enabling more informed investment decisions. Here are some ways to use the gold platinum ratio in your investment strategy:
-
Identify Undervalued Metals: A low gold platinum ratio may indicate that platinum is undervalued compared to gold, presenting a potentially attractive investment opportunity. Conversely, a high ratio might suggest that gold is undervalued relative to platinum.
-
Diversify Your Portfolio: Investing in both gold and platinum can help spread risk and potentially increase returns. The gold platinum ratio can guide you in determining the optimal allocation of your investment portfolio, balancing stability and growth.
-
Monitor Market Trends: The gold platinum ratio can provide valuable insights into market trends and sentiment. For example, a rising ratio may indicate increasing demand for gold and decreasing demand for platinum, reflecting broader economic conditions.
-
Set Price Targets: Investors can use the gold platinum ratio to set price targets for buying or selling gold and platinum. For instance, if the ratio is currently 1.5, you might set a target to buy platinum when the ratio falls to 1.2, capitalizing on potential market shifts.
-
Hedge Against Market Volatility: The gold platinum ratio can also be used to hedge against market volatility. If you anticipate a rise in the gold price, you might buy gold and sell platinum to profit from the potential increase in the ratio, thus managing risk effectively.
By incorporating the gold platinum ratio into your investment strategy, you can gain a deeper understanding of the precious metals market and make more informed decisions. Whether you’re looking to buy gold, invest in platinum, or simply monitor market trends, this ratio serves as a valuable tool in navigating the complexities of the global economy.
Forecasting Future Trends in Gold to Platinum Ratios
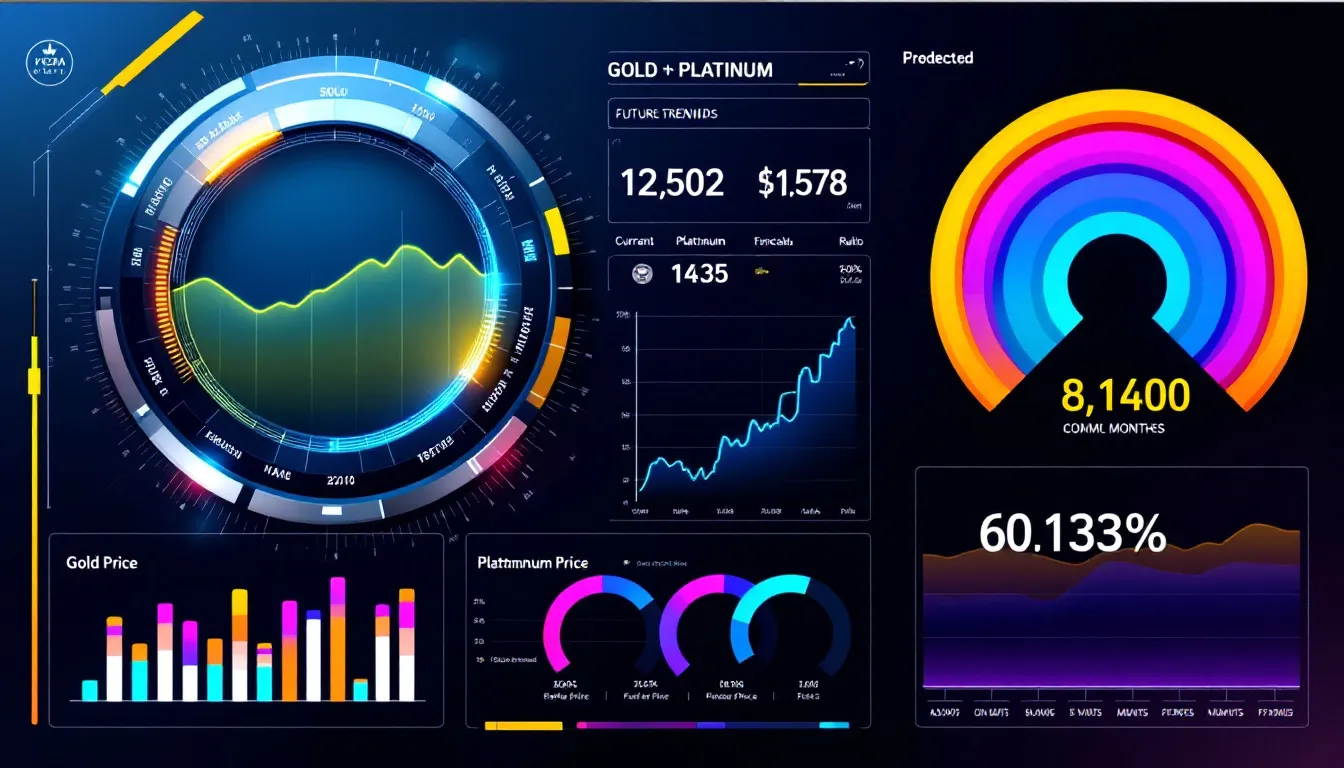
Forecasting future trends in the gold-to-platinum ratio is fraught with uncertainties. Technological advancements, such as the rise of hydrogen fuel cells, may create new demand for platinum in the future. The highly concentrated supply of platinum, primarily from South Africa, makes its price sensitive to regional disruptions.
Gold prices are generally more stable and are viewed as a safe investment during economic uncertainties, while platinum’s industrial demand makes it more volatile. Predictions based on historical cycles and current data suggest possible future trends in the gold-to-platinum ratio, often measured in troy ounces. This measure illustrates how many troy ounces of platinum can be purchased for one troy ounce of gold, providing insights into which metal might be undervalued or a better investment choice. However, these forecasts carry inherent risks and uncertainties that must be carefully considered.
Lessons for Investors
Understanding the historical price ratios of gold and platinum provides investors with key insights into market behavior and price dynamics. To manage risk and potential growth optimally, investors should consider allocating 5%-15% of their total portfolios to precious metals. New investors are advised to prioritize established metals like gold bullion to enhance stability and reduce volatility.
Being informed about the factors affecting gold and platinum prices is crucial for making sound investment decisions. The gold-to-platinum price ratio holds significant implications for investors and policymakers in determining market strategies. Continuous research and monitoring are crucial for adapting to changing market conditions.
Predicting future trends involves considering economic recovery, inflation, electric vehicle transitions, supply constraints, investment demand, and currency policies.
-
If inflation remains high, gold may continue outperforming; stable conditions could favor platinum’s industrial demand.
-
Electric vehicles may reduce platinum use in converters but increase it in fuel cells, with net effects uncertain.
-
South African supply constraints could support platinum prices, while gold’s safe-haven appeal persists.
-
A weaker dollar benefits both, but gold responds more strongly.
The ratio may favor gold near-term due to uncertainties, but stabilization could lower it.
Summary
The gold-to-platinum price ratio serves as a powerful tool for understanding the dynamic interplay between these two precious metals and the broader economic landscape. From historical trends to future forecasts, this comprehensive analysis provides valuable insights for investors looking to navigate the complexities of the precious metals market. Utilizing live gold data is crucial for staying informed with up-to-date price alerts and tools, which are essential for understanding the gold to platinum price ratios.
As we move forward, the lessons learned from this analysis will continue to guide investors and policymakers in making informed decisions. Embracing the knowledge of these price ratios will not only enhance investment strategies but also strengthen resilience in an ever-changing economic environment.
Frequently Asked Questions
Is platinum higher price than gold?
Platinum is generally more expensive than gold due to its scarcity, as over 1,000 tons of gold are mined annually compared to just over 150 tons of platinum. This limited supply contributes to platinum's higher price in the market.
What is the relationship between gold and platinum prices?
Gold and platinum prices have a historical relationship where platinum is typically more expensive due to its greater rarity and industrial applications. However, this relationship can fluctuate based on market conditions.
Why do investors track the gold-to-platinum ratio?
Investors track the gold-to-platinum ratio to make informed decisions on purchasing either metal, as it indicates market conditions and broader economic trends. This ratio serves as a critical indicator for potential investment opportunities.
How has the gold-to-platinum ratio changed over time?
The gold-to-platinum ratio has experienced significant fluctuations, particularly peaking in 2015 and 2020, driven by economic downturns and heightened demand for gold as a safe-haven asset. Historically, this ratio illustrates how many troy ounces of platinum can be purchased for one troy ounce of gold. These trends highlight the dynamic nature of precious metals in response to market conditions.
What is the 80/50 rule for gold silver?
The 80/50 rule recommends transitioning to silver when the gold to silver ratio exceeds 80 ounces of silver for every ounce of gold, and shifting back to gold when the ratio falls below 50. This strategy can help optimize the investment between these two precious metals.
Related Articles
When The World's Biggest Banks Force Price Discovery On Gold, Pay Attention
The Hot Take In late June 2026, six of China's largest state-owned banks — ICBC, China Construct...
Discover More
The 2026 Walking Liberty Gold Coin Is Coming. Here's Why It Matters.
There are certain coin designs that, once you have seen them, you do not forget. They live in a p...
Discover More
Krugerrand vs American Gold Eagle: Which Should You Actually Buy in 2026?
By Stephen Pfeil — Global Coin If you’ve spent any time researching gold bullion, you’ve run into...
Discover More
Leave a comment
This site is protected by hCaptcha and the hCaptcha Privacy Policy and Terms of Service apply.